
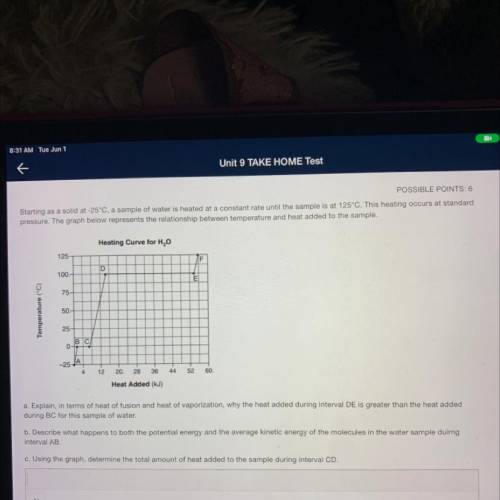
Starting as a solid at -25°C, a sample of water is heated at a constant rate until the sample is at 125°C. This heating occurs at standard
pressure. The graph below represents the relationship between temperature and heat added to the sample.
Heating Curve for H2O
125
F
D
100.
E
75
Temperature (°C)
50.
25
BC
0-
-25-
<
12
20.
28
36
44
52
60.
Heat Added (kJ)
a. Explain, in terms of heat of fusion and heat of vaporization, why the heat added during interval DE is greater than the heat added
during BC for this sample of water.
b. Describe what happens to both the potential energy and the average kinetic energy of the molecules in the water sample duirng
interval AB
c. Using the graph, determine the total amount of heat added to the sample during interval
Please hurry answering all!:)

Answers: 2


Another question on Chemistry
Chemistry, 22.06.2019 06:00
How many atoms of mg are present in 97.22 grams of mg? 6.022 × 10²³ 2.408 × 1024 4.818 × 1024 5.855 × 1025
Answers: 2
Chemistry, 22.06.2019 12:10
Achemistry student needs to standardize a fresh solution of sodium hydroxide. he carefully weighs out of oxalic acid , a diprotic acid that can be purchased inexpensively in high purity, and dissolves it in of distilled water. the student then titrates the oxalic acid solution with his sodium hydroxide solution. when the titration reaches the equivalence point, the student finds he has used of sodium hydroxide solution.calculate the molarity of the student's sodium hydroxide solution. be sure your answer has the correct number of significant digits.
Answers: 1
Chemistry, 23.06.2019 06:00
Jenny wants to test the electrical conductivity of two substances dissolved in water. she is preparing the containers for the experiment. which factor is most important for her to control?
Answers: 1
Chemistry, 23.06.2019 06:20
An object of mass 10.0 kg and volume 1000 ml and density 10 g/ml sinks in water who’s density is 1.0 g/ml. what is the mass of the water which has been displaced in kilograms
Answers: 1
You know the right answer?
Starting as a solid at -25°C, a sample of water is heated at a constant rate until the sample is at...
Questions

Biology, 12.08.2020 18:01


Mathematics, 12.08.2020 18:01
Chemistry, 12.08.2020 18:01
English, 12.08.2020 18:01
Mathematics, 12.08.2020 18:01
Mathematics, 12.08.2020 18:01

Mathematics, 12.08.2020 18:01
Mathematics, 12.08.2020 18:01
History, 12.08.2020 18:01


