
Chemistry, 19.05.2021 22:00 torieegrey
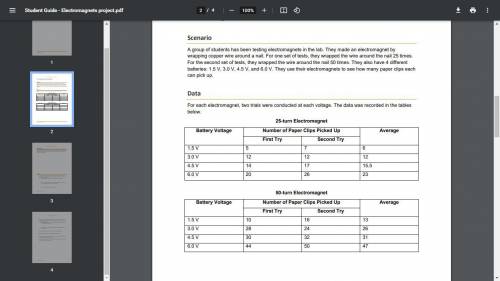
Make a line graph of the data found above. On the same graph, show the average number of paper clips
each electromagnet picked up for each voltage tested. Plot the voltage on the x-axis and the average
number of paper clips picked up on the y-axis. Scale the x-axis in intervals of 1.5 volts and scale the y-axis in intervals of 5 paper clips.

Answers: 2


Another question on Chemistry
Chemistry, 22.06.2019 12:20
Achemistry student weighs out 0.306 g of citric acid (h3c6h5o7), a triprotic acid, into a 250 ml volumetric flask and dilutes to the mark with distilled water. he plans to titrate the acid with 0.1000 m naoh solution. calculate the volume of naoh solution the student will need to add to reach the final equivalence point. be sure your answer has the correct number of significant digits.
Answers: 3
Chemistry, 22.06.2019 22:30
Is the idea of spontaneous generation supported by redi's experiment? justify your answer in 2-3 sentences?
Answers: 1
Chemistry, 23.06.2019 07:30
Assume that 13.5 g solid aluminum (al) react with hcl to produce solid aluminum chloride (alcl3) salt and gaseous hydrogen (h2) at standard temperature and pressure.
Answers: 1
Chemistry, 23.06.2019 08:00
Suppose a pair of chemical compounds a and b can react in two different ways: a + b -> c reaction 1 gives product c. a + b -> d reaction 2 gives product d. the following facts are known about the two reactions: . reaction 1 is endothermic and reaction 2 is exothermic. if a reaction vessel is charged (filled) with a and b , then at first d is produced faster than c. use these facts to sketch a qualitative reaction energy diagram for both reactions. note: because these sketches are only qualitative, the energies don? t have to be exact. they only have to have the right relationship to each other. for example, if one energy is less than another, that fact should be clear in your sketch.
Answers: 3
You know the right answer?
Make a line graph of the data found above. On the same graph, show the average number of paper clips...
Questions


Geography, 02.02.2021 22:40


Mathematics, 02.02.2021 22:40
Mathematics, 02.02.2021 22:40
Mathematics, 02.02.2021 22:40
Mathematics, 02.02.2021 22:40
Mathematics, 02.02.2021 22:40

History, 02.02.2021 22:40

English, 02.02.2021 22:40
Mathematics, 02.02.2021 22:40
Mathematics, 02.02.2021 22:40

Law, 02.02.2021 22:40
Mathematics, 02.02.2021 22:40


