
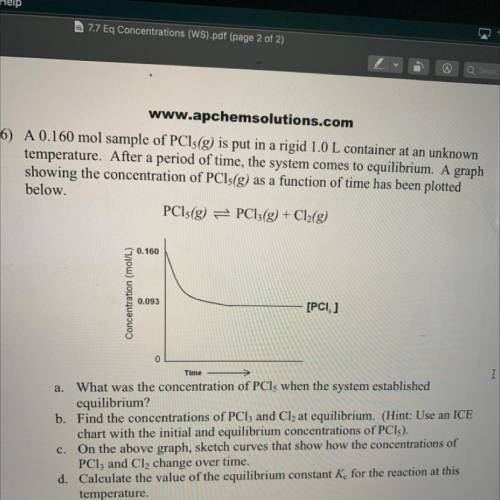
6) A 0.160 mol sample of PCls(g) is put in a rigid 1.0 L container at an unknown
temperature. After a period of time, the system comes to equilibrium. A graph
showing the concentration of PCls(g) as a function of time has been plotted
below.
PCls(g) = PC13(g) + Cl2(g)
0.160
Concentration (mol/L)
0.093
[PCI, ]
I
Time
a. What was the concentration of PCls when the system established
equilibrium?
b. Find the concentrations of PCl3 and Cl2 at equilibrium. (Hint: Use an ICE
chart with the initial and equilibrium concentrations of PCI).
c. On the above graph, sketch curves that show how the concentrations of
PClz and Cl, change over time.
d. Calculate the value of the equilibrium constant K for the reaction at this
temperature.

Answers: 2


Another question on Chemistry
Chemistry, 21.06.2019 19:00
Consider the point on the plot where 10.0 g of naoh have been added. what amount of naoh, in moles, has been added? 0.308 mol fecl3 initially present
Answers: 1
Chemistry, 22.06.2019 01:00
How can you use chemical equations to predict the products of the reaction you can carry out?
Answers: 1
Chemistry, 22.06.2019 11:00
Which are examples of how technology has advanced scientific understanding.1using hot water to sterilize medical equipment.2transplanting a human organ into another individual.3inserting genes from one sheep into another cell to make a cloneunderstanding the different structures that make up a cell.4examining microorganisms from the deepest parts of the ocean
Answers: 2
Chemistry, 22.06.2019 12:30
Place the elements below in order of decreasing ionization energy. aluminum(al) chlorine(cl) magnesium (mg) sulfur(s)
Answers: 1
You know the right answer?
6) A 0.160 mol sample of PCls(g) is put in a rigid 1.0 L container at an unknown
temperature. After...
Questions

Social Studies, 02.05.2021 01:00

Computers and Technology, 02.05.2021 01:00


History, 02.05.2021 01:00


Mathematics, 02.05.2021 01:00
Mathematics, 02.05.2021 01:00

English, 02.05.2021 01:00
Mathematics, 02.05.2021 01:00
Mathematics, 02.05.2021 01:00


