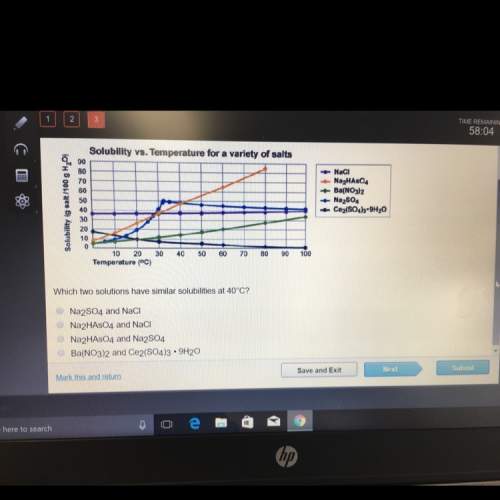
The graph below shows how solubility changes with temperature
...

Chemistry, 29.08.2019 16:00 clairee002
The graph below shows how solubility changes with temperature

Answers: 1


Another question on Chemistry
Chemistry, 21.06.2019 23:00
Select the correct answer. given: 2libr + ba → babr2 + 2li in this chemical reaction, 325 grams of barium (ba) react completely. how many moles of lithium (li) are produced? a. 1.18 mol b. 2.37 mol c. 4.73 mol d. 16.4 mol e. 32.9 mol
Answers: 2
Chemistry, 22.06.2019 14:10
Precision can be defined as the o exact center of a data set. o reproducibility of a measured value. o correlation between two variables that are measured in a data set agreement between a measured value and an accepted value.
Answers: 2
Chemistry, 22.06.2019 21:00
What is the chemical formula for the compound formed between sodium and flour one
Answers: 1
Chemistry, 23.06.2019 02:50
What is the typical rotational frequency frot for a molecule like n2 at room temperature (25∘c)? assume that d for this molecule is 1å=10−10m. take the total mass of an n2 molecule to be mn2=4.65×10⁻²⁶kg. you will need to account for rotations around two axes (not just one) to find the correct frequency. express frot numerically in hertz, to three significant figures.
Answers: 3
You know the right answer?
Questions
Chemistry, 25.10.2021 23:00


Business, 25.10.2021 23:00

Mathematics, 25.10.2021 23:00

Biology, 25.10.2021 23:00
Mathematics, 25.10.2021 23:00
Biology, 25.10.2021 23:00
Mathematics, 25.10.2021 23:00

Computers and Technology, 25.10.2021 23:00
English, 25.10.2021 23:00
Computers and Technology, 25.10.2021 23:00

Mathematics, 25.10.2021 23:00
Mathematics, 25.10.2021 23:00


