(View table above)
To assist you, use the enthalpy values in the data chart for each gene...

(View table above)
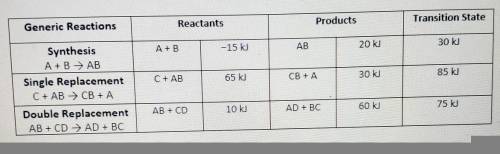
To assist you, use the enthalpy values in the data chart for each generic reaction provided. Be sure to following the summary of steps below.
• Illustrate the x- and y-axes to show the reaction pathway and potential energy, in kilojoules. Ensure your energy intervals are appropriate for the data
• Plot the enthalpy values of the reactants, products, and transition state using three horizontal dotted lines across the graph for each
• Draw the energy curve from the reactants line to the transition state and curve the line back down to the energy of the products. Label the reactants, products, and transition state.
• Illustrate double-headed arrows to represent both the total change in enthalpy (ΔH) and the activation energy (Ea).
• Calculate the total change in enthalpy and the activation energy using the energy values provided for each reaction. Record those values below the graph.
• Make sure correct units are included.
Conclusion Statement
Write a two to four sentence conclusion statement explaining how the potential energy diagram is used to identify if the reaction is endothermic or exothermic, if heat was released or absorbed, and why the sign of enthalpy change was positive of negative. There should be a conclusion statement for each graph.

Answers: 2


Another question on Chemistry
Chemistry, 23.06.2019 11:30
Which of the following is the most likeley example of an favorable mutation a. a mutation that makes a rabbit able run faster b. a mutation that changes the rabbit's fur to bright orange c. a mutation that changes the color of the rabbit's eyes d. a mutation that gives a rabbit a third ear
Answers: 1
Chemistry, 23.06.2019 16:50
How can a scientist assess whether a pure niobium (nb) sample is responsible for contaminating the lab with radioactivity? test the niobium sample to see whether it now contains other elements.test the niobium sample for the presence of niobium oxide compounds.heat the niobium, and see if the level of radioactivity in the lab increases.place the niobium under pressure, and see if the level of radioactivity in the lab increases.
Answers: 3
Chemistry, 23.06.2019 19:30
Which of the following is an example of ionic compound? a) sicl4 b) hcl c) cacl2 d) ccl4
Answers: 1
Chemistry, 23.06.2019 21:30
Explain why the epa is not present as defined by weston wilson
Answers: 1
You know the right answer?
Questions

Social Studies, 07.01.2021 17:20
Social Studies, 07.01.2021 17:20
Social Studies, 07.01.2021 17:20


Mathematics, 07.01.2021 17:20


Mathematics, 07.01.2021 17:20
Social Studies, 07.01.2021 17:20

English, 07.01.2021 17:20


