(View table above)
To assist you, use the enthalpy values in the data chart for each gene...

(View table above)
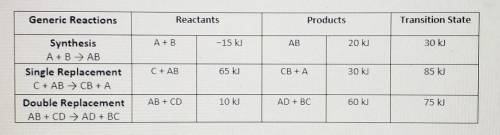
To assist you, use the enthalpy values in the data chart for each generic reaction provided. Be sure to following the summary of steps below.
• Illustrate the x- and y-axes to show the reaction pathway and potential energy, in kilojoules. Ensure your energy intervals are appropriate for the data
• Plot the enthalpy values of the reactants, products, and transition state using three horizontal dotted lines across the graph for each
• Draw the energy curve from the reactants line to the transition state and curve the line back down to the energy of the products. Label the reactants, products, and transition state.
• Illustrate double-headed arrows to represent both the total change in enthalpy (ΔH) and the activation energy (Ea).
• Calculate the total change in enthalpy and the activation energy using the energy values provided for each reaction. Record those values below the graph.
• Make sure correct units are included.
Conclusion Statement
Write a two to four sentence conclusion statement explaining how the potential energy diagram is used to identify if the reaction is endothermic or exothermic, if heat was released or absorbed, and why the sign of enthalpy change was positive of negative. There should be a conclusion statement for each graph.

Answers: 2


Another question on Chemistry
Chemistry, 22.06.2019 08:00
Why is the bond angle in a water molecule less than the bond angle of methane? a. the central oxygen atom in water has two lone pairs of electrons, whereas the central carbon atom in methane has no lone pairs. b. the central hydrogen atom in water has one lone pair of electrons, whereas the central carbon atom in methane has two lone pairs. c. the central oxygen atom in water has four lone pairs of electrons, whereas the central carbon atom in methane has only one lone pair. d. the central oxygen atom exerts more repulsive force on surrounding atoms than the central carbon atom in methane does. reset next
Answers: 2
Chemistry, 23.06.2019 02:50
For questions 1 and 2, consider the following experimental data.hydrogen emission lines were detected at the following wavelengths (in nm): 121.6102.697.395.093.8question 1use the electromagnetic radiation classifications below and figure 1-1 in the introductory information for this lab (in the lab manual) to determine the nf value for the experimental data provided? wavelength, ? (nm) 650 700 550 600 400 450 500 visible spectrum wavelength, ? (m) 11 10 3 10 10 10 8 10 5 10 10 -10 10 9 10 10 10 10 -12 10 microwave radio infrared x-ray ultraviolet gamma 1020 1019 1018 1 1016 015 1014 01 12 109108 frequency, v (hz)a.1b. 2c. 3d. 4e. 5question 2using the data for the emission line with the longest wavelength, the known value of nf (from question 1 in this prelab), and the value of ni (deduced from the ? and nf values) calculate the rydberg constant for hydrogen (rh) in units of m-1.a) 1.097 x 10⁻¹¹ m-1b) 5.921 x 10⁷ m-1c) 1.097 x 10⁻² m-1d) 9.252 x 10⁶ m-1e) 1.097 x 10⁷ m-1
Answers: 3
Chemistry, 23.06.2019 14:00
Which word refers to the smallest functional unit of living thing
Answers: 1
You know the right answer?
Questions

Mathematics, 20.04.2021 17:10
Mathematics, 20.04.2021 17:10
Mathematics, 20.04.2021 17:20

History, 20.04.2021 17:20

English, 20.04.2021 17:20
History, 20.04.2021 17:20
English, 20.04.2021 17:20
Mathematics, 20.04.2021 17:20
Mathematics, 20.04.2021 17:20
Mathematics, 20.04.2021 17:20

Biology, 20.04.2021 17:20
Mathematics, 20.04.2021 17:20


