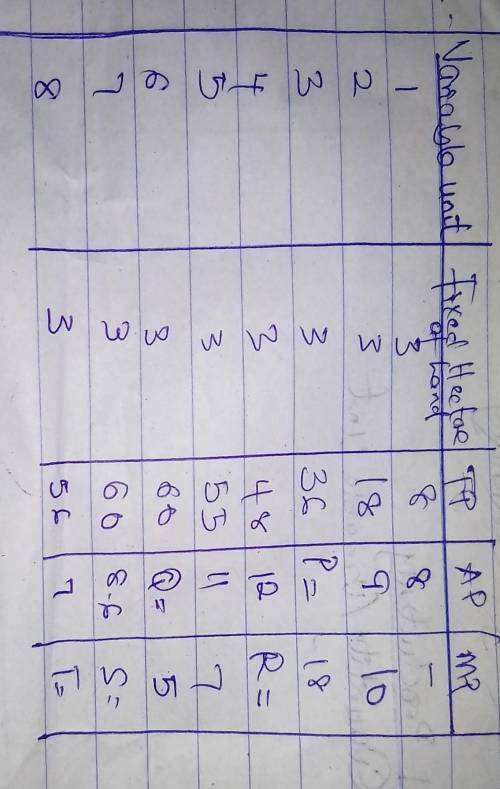
See image for Table. Please show workings.
1. Complete the table by calculating the missing letters ( P, Q , R ,S ,T ) showing your workings clearly.
2. Draw the total product and marginal product curve in one diagram.
3. Explain the relationship between Tp and Mp. (Optional)
Note : Tp= Total Product
Mp = Marginal Product
Ap = Average Product


Answers: 3


Another question on Business

Business, 22.06.2019 12:50
Jallouk corporation has two different bonds currently outstanding. bond m has a face value of $50,000 and matures in 20 years. the bond makes no payments for the first six years, then pays $2,100 every six months over the subsequent eight years, and finally pays $2,400 every six months over the last six years. bond n also has a face value of $50,000 and a maturity of 20 years; it makes no coupon payments over the life of the bond. the required return on both these bonds is 10 percent compounded semiannually. what is the current price of bond m and bond n?
Answers: 3

Business, 22.06.2019 17:30
Kevin and jenny, who are both working full-time, have three children all under the age of ten. the two youngest children, who are three and five years old, attended eastside pre-school for a total cost of $3,000. ervin, who is nine, attended big kid daycare after school at a cost of $2,000. jenny has earned income of $15,000 and kevin earns $14,000. what amount of childcare expenses should be used to determine the child and dependent care credit?
Answers: 3

Business, 22.06.2019 22:50
Total marketing effort is a term used to describe the critical decision factors that affect demand: price, advertising, distribution, and product quality. define the variable x to represent total marketing effort. a typical model that is used to predict demand as a function of total marketing effort is based on the power function: d = axb suppose that a is a positive number. different model forms result from varying the constant b. sketch the graphs of this model for b = 0, b = 1, 0< b< 1, b< 0, and b> 1. (we encourage you to use excel to do this.) what does each model tell you about the relationship between demand and marketing effort? what assumptions are implied? are they reasonable? how would you go about selecting the appropriate model?
Answers: 1

Business, 22.06.2019 23:00
The quinoa seed is in high demand in wealthier countries such as the u.s. and japan. approximately 97% of all quinoa production comes from small farmers in bolivia and peru who farm at high elevations—8,000 feet or higher. the seed is considered highly nutritious. mostly grown and harvested in bolivia and peru, and sold to markets in other countries, the seed is now considered an important for these nations. the governments of bolivia and peru are hopeful that this product will increase the quality of life of their farmers.
Answers: 3
You know the right answer?
See image for Table. Please show workings.
1. Complete the table by calculating the missing letters...
Questions


Geography, 25.11.2019 15:31


Mathematics, 25.11.2019 15:31

Biology, 25.11.2019 15:31

History, 25.11.2019 15:31

Chemistry, 25.11.2019 15:31


Mathematics, 25.11.2019 15:31

Mathematics, 25.11.2019 15:31

History, 25.11.2019 15:31


Mathematics, 25.11.2019 15:31

Business, 25.11.2019 15:31

Physics, 25.11.2019 15:31


Mathematics, 25.11.2019 15:31

Mathematics, 25.11.2019 15:31


