Question 8 of 10
Which sentence best completes the diagram?
A central bank raises inter...

Business, 02.12.2020 22:10 liltay12386
Question 8 of 10
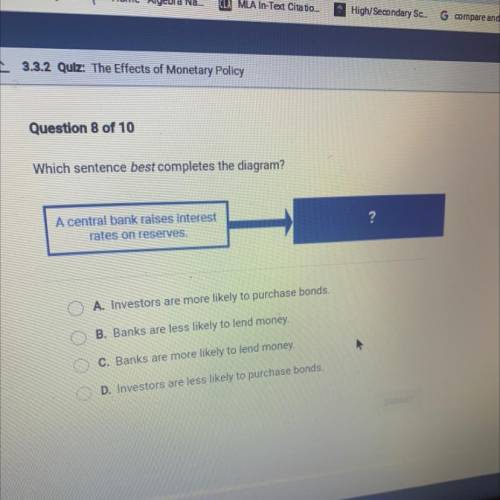
Which sentence best completes the diagram?
A central bank raises interest
rates on reserves.
A. Investors are more likely to purchase bonds.
B. Banks are less likely to lend money.
C. Banks are more likely to lend money
D. Investors are less likely to purchase bonds.

Answers: 2


Another question on Business
Business, 21.06.2019 20:20
If the demand for a pair of shoes is given by 2p + 5q = 200 and the supply function for it is p − 2q = 10, compare the quantity demanded and the quantity supplied when the price is $90. quantity demanded pairs of shoes quantity supplied pairs of shoes will there be a surplus or shortfall at this price? there will be a surplus. there will be a shortfall.
Answers: 3
Business, 21.06.2019 23:00
What is overdraft protection (odp)? a.) a cheap and easy way to always avoid overdrawing a bank account b.) a service to automatically transfer available funds from a linked account to cover purchases, prevent returned checks and declined items when you don’t have enough money in your checking account at the time of the transaction. c.) an insurance policy sold by banks to prevent others from withdrawing your money d.) a service provided by the government that insures individuals bank deposits up to $250,000
Answers: 2
Business, 22.06.2019 00:30
A) plot the m1 and m2 money stock in the us from 1990-2015. (hint: you may use the data tools provided by fred.) (b) plot the nominal interest rate from 1960 to 2014. (hint: you can either use the daily interest rates for selected u.s. treasury, private money market and capital market instruments from or the effective federal funds rate fromfred.) (c) the consumer price index (cpi) is a measure of the average change over time in the prices paid by urban consumers for a market basket of consumer goods and services. intuitively, the cpi represents the cost of living or the average price level. plot the cpi from 1960 to 2013.(d) the inflation rate is the yearly percentage change in the average price level. in practice, we usually use the percentage change in the cpi to compute the inflation rate. plot the inflation rate from 1960 to 2013.(e) explain the difference between the ex-ante and ex-post real interest rate. use the fisher equation to compute the ex-post real interest rate. plot the nominal interest rate and the ex-post real interest rate from 1960 to 2013 in the same graph.
Answers: 3
Business, 22.06.2019 04:00
Don’t give me to many notifications because it will cause you to lose alot of points
Answers: 1
You know the right answer?
Questions

History, 06.07.2021 21:00


English, 06.07.2021 21:00
Mathematics, 06.07.2021 21:00
Mathematics, 06.07.2021 21:00


Physics, 06.07.2021 21:00
Mathematics, 06.07.2021 21:00
Mathematics, 06.07.2021 21:00
Mathematics, 06.07.2021 21:00


