
Business, 17.10.2020 21:01 unknown1246
Your boss would like your help on a marketing research project he is conducting on the relationship between the price of soup and the quantity of soup supplied. He hands you the following document:
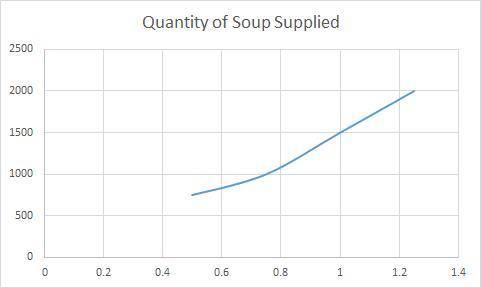
Price of Soup Quantity of Soup Supplied
0.50 750
0.75 1,000
1.00 1,500
1.25 2,000
Your task is to take this blank and construct a graphical representation of the data. In doing so, you determine that as the price of soup rises, the quantity of soup supplied increases. This confirms the blank.
For both blanks, the choices are supply curve, quantity of soup supplied, supply schedule, and law of supply. I got law of supply for the first blank, and supply curve for the second blank and I wanted to make sure if I was correct.

Answers: 1


Another question on Business
Business, 22.06.2019 16:50
Coop inc. owns 40% of chicken inc., both coop and chicken are corporations. chicken pays coop a dividend of $10,000 in the current year. chicken also reports financial accounting earnings of $20,000 for that year. assume coop follows the general rule of accounting for investment in chicken. what is the amount and nature of the book-tax difference to coop associated with the dividend distribution (ignoring the dividends received deduction)?
Answers: 2
Business, 22.06.2019 23:30
Mystic bottling company bottles popular beverages in the bottling department. the beverages are produced by blending concentrate with water and sugar. the concentrate is purchased from a concentrate producer. the concentrate producer sets higher prices for the more popular concentrate flavors. a simplified bottling department cost of production report separating the cost of bottling the four flavors follows:
Answers: 3
Business, 22.06.2019 23:40
Four key marketing decision variables are price (p), advertising (a), transportation (t), and product quality (q). consumer demand (d) is influenced by these variables. the simplest model for describing demand in terms of these variables is: d = k – pp + aa + tt + qq where k, p, a, t, and q are constants. discuss the assumptions of this model. specifically, how does each variable affect demand? how do the variables influence each other? what limitations might this model have? how can it be improved?
Answers: 2
Business, 23.06.2019 01:00
As more people migrated west during the gold rush, what do you think happened to the demand curve in most western markets, holding all else constant? a. there was no shift, nor any increase or decrease in quantity demanded. b. there was no shift, but there was a decrease in quantity demanded. c. the demand curve shifted to the left. d. the demand curve shifted to the right. e. there was no shift, but there was an increase in quantity demanded.
Answers: 2
You know the right answer?
Your boss would like your help on a marketing research project he is conducting on the relationship...
Questions

Physics, 22.07.2019 00:00

Physics, 22.07.2019 00:00

Mathematics, 22.07.2019 00:00
Mathematics, 22.07.2019 00:00
Mathematics, 22.07.2019 00:00
English, 22.07.2019 00:00

History, 22.07.2019 00:00

Biology, 22.07.2019 00:00


