
Business, 20.09.2020 06:01 jaygamer37
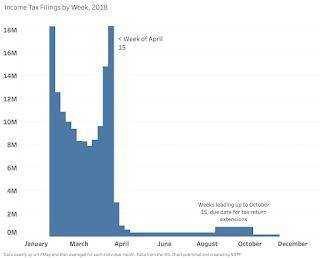
1. Why do you think no one filed their taxes in the month of January? In the graph above!
2. Formulate an equation that would allow you to calculate the percentage of people who filed their taxes during the week of April 15th from the graph above.
Help me asap , please !

Answers: 2


Another question on Business
Business, 22.06.2019 04:30
Annuity payments are assumed to come at the end of each payment period (termed an ordinary annuity). however, an exception occurs when the annuity payments come at the beginning of each period (termed an annuity due). what is the future value of a 13-year annuity of $2,800 per period where payments come at the beginning of each period? the interest rate is 9 percent. use appendix c for an approximate answer, but calculate your final answer using the formula and financial calculator methods. to find the future value of an annuity due when using the appendix tables, add 1 to n and subtract 1 from the tabular value. for example, to find the future value of a $100 payment at the beginning of each period for five periods at 10 percent, go to appendix c for n = 6 and i = 10 percent. look up the value of 7.716 and subtract 1 from it for an answer of 6.716 or $671.60 ($100 × 6.716)
Answers: 2
Business, 22.06.2019 05:30
Financial information that is capable of making a difference in a decision is
Answers: 3
Business, 22.06.2019 12:50
Kendrick is leaving his current position at a company, and charlize is taking over. kendrick set up his powerpoint for easy access for himself. charlize needs to work in the program that is easy for her to use. charlize should reset advanced options
Answers: 3
Business, 22.06.2019 21:10
This problem has been solved! see the answerthe xyz corporation is interested in possible differences in days worked by salaried employees in three departments in the financial area. a survey of 23 randomly chosen employees reveals the data shown below. because of the casual sampling methodology in this survey, the sample sizes are unequal. research question: are the mean annual attendance rates the same for employees in these three departments? days worked last year by 23 employees department days worked budgets (5 workers) 278 260 265 245 258 payables (10 workers) 205 270 220 240 255 217 266 239 240 228 pricing (8 workers) 240 258 233 256 233 242 244 249 picture click here for the excel data filefill in the missing data. (round your p-value to 4 decimal places, mean values to 1 decimal place and other answers to 2group mean n std. dev variancesbudgets payables pricing total one factor anova source ss df ms f p-value treatment error total
Answers: 2
You know the right answer?
1. Why do you think no one filed their taxes in the month of January? In the graph above!
2. Formul...
Questions


History, 10.02.2021 07:10

Mathematics, 10.02.2021 07:10
Mathematics, 10.02.2021 07:10

Biology, 10.02.2021 07:10
Biology, 10.02.2021 07:10
Mathematics, 10.02.2021 07:10
History, 10.02.2021 07:10
Mathematics, 10.02.2021 07:10
History, 10.02.2021 07:10
History, 10.02.2021 07:10
Mathematics, 10.02.2021 07:10


