
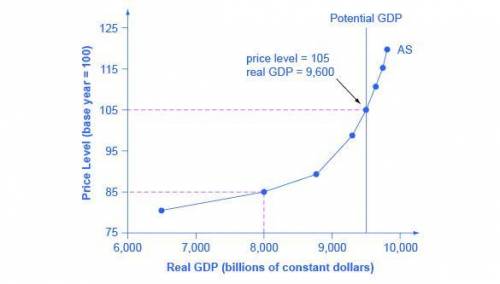
Draw and carefully describe a graph that utilizes the Aggregate Demand/Aggregate Supply model that would illustrate the current state of the aggregate economy in the United States as of July 2020. The Aggregate Demand/Aggregate Supply Model is first introduced in Chapter 11 (Links to an external site.) of your text and is further explicated in Chapters 12 and 13. Make sure that you explain your graph in your own words. Your graph needs to be clearly labeled and explained in some detail. Your graph must include an aggregate demand (AD) curve, a short run aggregate supply (SRAS) curve, and a long run aggregate supply curve (LRAS, Potential GDP) curve. You should clearly label both axes of the graph. Identify the current price level using the GDP deflator (Links to an external site.) on the vertical axis and the level of real GDP (Links to an external site.) on the horizontal axis. You don’t need to plot any other specific data points. Your graph needs to be clearly labeled and explained in some detail. Your graph must include an aggregate demand (AD) curve, a short run aggregate supply (SRAS) curve, and a long run aggregate supply curve (LRAS, Potential GDP) curve. You should clearly label both axes of the graph. Identify the current price level using the GDP deflator (Links to an external site.) on the vertical axis and the level of real GDP (Links to an external site.) on the horizontal axis. You don’t need to plot any other specific data points. Please help!

Answers: 2


Another question on Business
Business, 22.06.2019 04:00
The simple interest in a loan of $200 at 10 percent interest per year is
Answers: 2
Business, 22.06.2019 06:30
If a seller prepaid the taxes of $4,400 and the closing is set for may 19, using the 12 month/30 day method what will the buyer owe the seller as prorated taxes?
Answers: 1
Business, 22.06.2019 10:30
Trecek corporation incurs research and development costs of $625,000 in 2017, 30 percent of which relate to development activities subsequent to ias 38 criteria having been met that indicate an intangible asset has been created. the newly developed product is brought to market in january 2018 and is expected to generate sales revenue for 10 years. assume that a u.s.–based company is issuing securities to foreign investors who require financial statements prepared in accordance with ifrs. thus, adjustments to convert from u.s. gaap to ifrs must be made. ignore income taxes. required: (a) prepare journal entries for research and development costs for the years ending december 31, 2017, and december 31, 2018, under (1) u.s. gaap and (2) ifrs. (c) prepare the entry(ies) that trecek would make on the december 31, 2017, and december 31, 2018, conversion worksheets to convert u.s. gaap balances to ifrs.
Answers: 1
Business, 22.06.2019 11:00
Which statement best describes the variety of workplaces commonly found in the health science career cluster? a. workplaces in this cluster include healthcare facilities such as hospitals, physician offices, and clinics. b. workplaces in this cluster include healthcare facilities, laboratories, and other environments such as offices or homes. c . workplaces in this cluster include nonprofit hospitals, government-run clinics, and private physicians' offices. d. workplaces in this cluster include private and nonprofit hospitals and clinics, and dentists' offices.
Answers: 1
You know the right answer?
Draw and carefully describe a graph that utilizes the Aggregate Demand/Aggregate Supply model that w...
Questions

Mathematics, 11.05.2021 01:50


Law, 11.05.2021 01:50

Mathematics, 11.05.2021 01:50


Arts, 11.05.2021 01:50
Mathematics, 11.05.2021 01:50

History, 11.05.2021 01:50

Law, 11.05.2021 01:50


