
Cicchetti Corporation uses customers served as its measure of activity. The following report compares the planning budget to the actual operating results for the month of December:
Cicchetti Corporation
Comparison of Actual Results to Planning Budget
For the Month Ended December 31
Actual Results Planning Budget Variances
Customers served 22,000 21,000
Revenue (3.40q) $75,200 $71,400 $3,800 F
Expenses:
Wages and salaries
($22,100 + $1.11q) 46,520 45,410 1,110 U
Supplies ($0.51q) 9,710 10,710 1,000 F
Insurance ($4,000) 4,000 4,000
Miscellaneous expense
($3,000 + $0.31q) 8,510 9,510 1,000 F
Total expense 68,740 69,630 890 F
Net operating
income $6,460 $1,770 $4,690 F
Required:
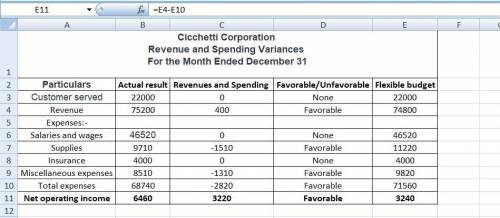
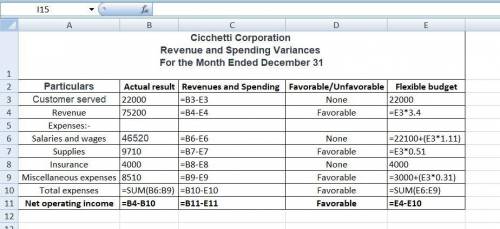
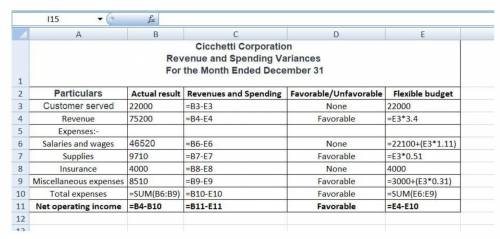
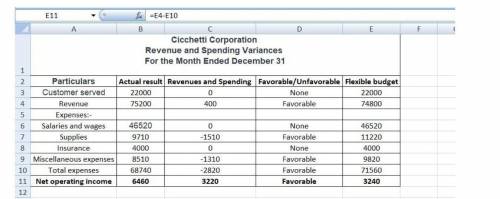
Prepare a report showing the company's revenue and spending variances for December. (Indicate the effect of each variance by selecting "F" for favorable, "U" for unfavorable, and "None" for no effect (i. e., zero variance).)
Cicchetti Corporation
Revenue and Spending Variances
For the Month Ended December 31

Answers: 3


Another question on Business
Business, 21.06.2019 14:00
Gibson's bodywork does automotive collision work. an insurance agency has determined that the standard time to replace a fender is 2.5 hours (i.e., "standard output" 0.4
Answers: 2
Business, 21.06.2019 20:20
If the government is required to balance the budget and the economy falls into a recession, which of the actions is a feasible policy response? cut taxes to encourage consumer spending invest in infrastructure increase government spending to stimulate the economy cut spending equal to the reduction in tax revenue what is a likely consequence of this policy? unemployment falls due to the economic stimulus. the negative consequences of the recession are magnified. consumer spending increases due to their ability to keep more of their after-tax income. there is hyperinflation due to an increase in aggregate demand.
Answers: 3
Business, 21.06.2019 21:40
Forecasting as a first step in the team’s decision making, it wants to forecast quarterly demand for each of the two types of containers for years 6 to 8. based on historical trends, demand is expected to continue to grow until year 8, after which it is expected to plateau. julie must select the appropriate forecasting method and estimate the likely forecast error. which method should she choose? why? using the method selected, forecast demand for years 6 to 8.
Answers: 2
Business, 22.06.2019 06:30
Selected data for stick’s design are given as of december 31, year 1 and year 2 (rounded to the nearest hundredth). year 2 year 1 net credit sales $25,000 $30,000 cost of goods sold 16,000 18,000 net income 2,000 2,800 cash 5,000 900 accounts receivable 3,000 2,000 inventory 2,000 3,600 current liabilities 6,000 5,000 compute the following: 1. current ratio for year 2 2. acid-test ratio for year 2 3. accounts receivable turnover for year 2 4. average collection period for year 2 5. inventory turnover for year 2
Answers: 2
You know the right answer?
Cicchetti Corporation uses customers served as its measure of activity. The following report compare...
Questions


Spanish, 18.03.2021 03:40
Mathematics, 18.03.2021 03:40
Mathematics, 18.03.2021 03:40
Mathematics, 18.03.2021 03:40
Mathematics, 18.03.2021 03:40
Mathematics, 18.03.2021 03:40
Physics, 18.03.2021 03:40
Mathematics, 18.03.2021 03:40

Chemistry, 18.03.2021 03:40
Mathematics, 18.03.2021 03:40
Mathematics, 18.03.2021 03:40
Mathematics, 18.03.2021 03:40


