
Business, 27.03.2020 22:51 lileljusto2829
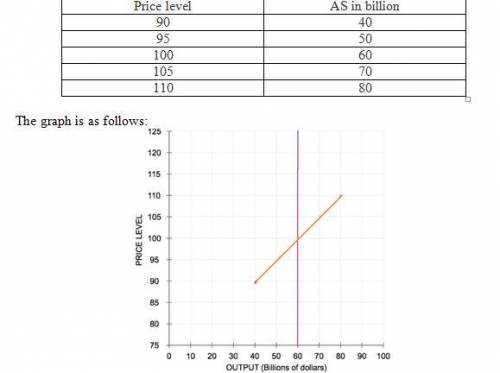
In the short run, the quantity of output that firms supply can deviate from the natural rate of output if the actual price level in the economy deviates from the expected price level. Several theories explain how this might happen. For example, the sticky-price theory asserts that the output prices of some goods and services adjust slowly to changes in the price level. Suppose firms announce the prices for their products in advance, based on an expected price level of 100 for the coming year. Many of the firms sell their goods through catalogs and face high costs of reprinting if they change prices. The actual price level turns out to be 90. Faced with high menu costs, the firms that rely on catalog sales choose not to adjust their prices. Sales from catalogs will (Remain the same/fall/rise), and firms that rely on catalogs will respond by (Increasing/Reducing) the quantity of output they supply. If enough firms face high costs of adjusting prices, the unexpected decrease in the price level causes the quantity of output supplied to (Fall below/Rise above) the natural rate of output in the short run. Suppose the economy's short-run aggregate supply (AS) curve is given by the following equation:Quantity of output supplied = Natural Rate of output + a x (Price level (actual) - Price level (expected))The Greek letter a represents a number that determines how much output responds to unexpected changes in the price level. In this case, assume that a= $2 Billion. That is, when the actual price level exceeds the expected price level by 1, the quantity of output supplied will exceed the natural rate of output by $2 billion. Suppose the natural rate of output is $60 billion of real GDP and that people expect a price level of 100.The short-run quantity of output supplied by firms will rise above the natural rate of output when the actual price level (rises above/falls below) the price level that people expected.

Answers: 3


Another question on Business
Business, 22.06.2019 00:10
What are the forecasted levels of the line of credit and special dividends? (hints: create a column showing the ratios for the current year; then create a new column showing the ratios used in the forecast. also, create a preliminary forecast that doesn’t include any new line of credit or special dividends. identify the financing deficit or surplus in this preliminary forecast and then add a new column that shows the final forecast that includes any new line of credit or special dividend.) now assume that the growth in sales is only 3%. what are the forecasted levels of the line of credit and special dividends?
Answers: 1
Business, 22.06.2019 17:40
Aproduct has a demand of 4000 units per year. ordering cost is $20, and holding cost is $4 per unit per year. the cost-minimizing solution for this product is to order: ? a. 200 units per order. b. all 4000 units at one time. c. every 20 days. d. 10 times per year. e. none of the above
Answers: 3
Business, 22.06.2019 17:50
What additional information about the numbers used to compute this ratio might be useful in you assess liquidity? (select all that apply) (a) the maturity schedule of current liabilities (b) the average stock price for the industry (c) the average current ratio for the industry (d) the amount of current assets that is concentrated in relatively illiquid inventories
Answers: 3
You know the right answer?
In the short run, the quantity of output that firms supply can deviate from the natural rate of outp...
Questions

Mathematics, 29.06.2021 18:50

Mathematics, 29.06.2021 18:50

Social Studies, 29.06.2021 19:00

Mathematics, 29.06.2021 19:00

Biology, 29.06.2021 19:00
Biology, 29.06.2021 19:00
History, 29.06.2021 19:00

Physics, 29.06.2021 19:00
Mathematics, 29.06.2021 19:00
Mathematics, 29.06.2021 19:00


