
The graph shows the federal budget from 1980 to 2010. What conclusion can be drawn from this graph?
a) Federal law requires the budget to be balanced.
b) Republicans do a good job in balancing the budget.
c) In most years, the federal budget shows a surplus.
d) The federal budget is usually unbalanced.
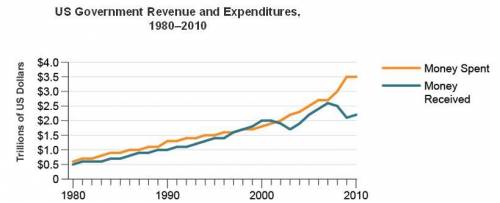

Answers: 3


Another question on Business
Business, 22.06.2019 08:30
The production manager of rordan corporation has submitted the following quarterly production forecast for the upcoming fiscal year: 1st quarter 2nd quarter 3rd quarter 4th quarter units to be produced 10,800 8,500 7,100 11,200 each unit requires 0.25 direct labor-hours, and direct laborers are paid $20.00 per hour. required: 1. prepare the company’s direct labor budget for the upcoming fiscal year. assume that the direct labor workforce is adjusted each quarter to match the number of hours required to produce the forecasted number of units produced. 2. prepare the company’s direct labor budget for the upcoming fiscal year, assuming that the direct labor workforce is not adjusted each quarter. instead, assume that the company’s direct labor workforce consists of permanent employees who are guaranteed to be paid for at least 2,500 hours of work each quarter. if the number of required direct labor-hours is less than this number, the workers are paid for 2,500 hours anyway. any hours worked in excess of 2,500 hours in a quarter are paid at the rate of 1.5 times the normal hourly rate for direct labor.
Answers: 2
Business, 22.06.2019 22:20
Which of the following is correct? a. a tax burden falls more heavily on the side of the market that is more elastic.b. a tax burden falls more heavily on the side of the market that is less elastic.c. a tax burden falls more heavily on the side of the market that is closer to unit elastic.d. a tax burden is distributed independently of the relative elasticities of supply and demand.
Answers: 1
Business, 22.06.2019 22:50
Amonopolist’s inverse demand function is p = 150 – 3q. the company produces output at two facilities; the marginal cost of producing at facility 1 is mc1(q1) = 6q1, and the marginal cost of producing at facility 2 is mc2(q2) = 2q2.a. provide the equation for the monopolist’s marginal revenue function. (hint: recall that q1 + q2 = q.)mr(q) = 150 - 6 q1 - 3 q2b. determine the profit-maximizing level of output for each facility.output for facility 1: output for facility 2: c. determine the profit-maximizing price.$
Answers: 3
Business, 23.06.2019 02:30
Suppose a starbucks tall latte cost $4.00 in the united states, 5.00 euros in the euro area and $2.50 australian dollars in australia. nominal exchange rates are .80 euros per dollar and 1.4 australian dollars per u.s. dollar. where does purchasing power parity hold? a. both the euro area and australia. b. neither the euro area or australia. c. the euro area but not australia. d. australia but not the euro area.
Answers: 1
You know the right answer?
The graph shows the federal budget from 1980 to 2010. What conclusion can be drawn from this graph?<...
Questions


Computers and Technology, 03.01.2020 21:31


Social Studies, 03.01.2020 21:31
Computers and Technology, 03.01.2020 21:31
Social Studies, 03.01.2020 21:31


