Biology, 03.09.2021 18:10 sjdpdpisdjsipjd7327
Which type of graph would be best to show qualitative data?
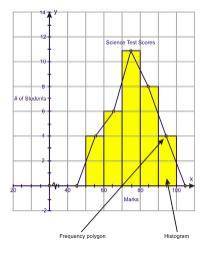
numerical data graph example
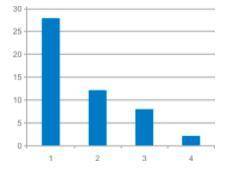
bar graph example


Answers: 1


Another question on Biology

Biology, 21.06.2019 13:20
Which sequence represents a cross section of the bilayera hydrophilic head, hydrophobic tail, hydrophobic tail, hydrophilic headb hydrophobic tail, hydrophilic head, hydrophobic tail, hydrophilic headc hydrophobic head, hydrophilic tail. hydrophilic tail, hydrophobic headd hydrophilic tail, hydrophobic head, hydrophobic head, hydrophilic tail
Answers: 3

Biology, 21.06.2019 23:00
The tasmanian devil, a marsupial carnivore, is facing extinction due to devil facial tumor disease (dftd) which causes bulging cancerous lumps and lesions to erupt around the face and neck — often causing enough deformation to make seeing or eating difficult. dftd has evolved into a contagious cancer, a trait that is unique among cancers. devil mating behavior involves biting around the head and neck, allowing cells from one individual — especially cells from the crumbly dftd tumors — to be transferred to the wounds or face of a new individual. this marsupial was once found across australia, but sea levels rose, isolating the tasmanian population, while the australian population went extinct. what would be an outcome of genetic isolation that is likely to have impacted the spread of dftd? a) reduced territory puts diseased individuals in greater contact with non-diseased ones. b) inbreeding results in less variation in facial features so the cancer is generally fatal. c) genetic isolation has made it difficult for scientists to develop a vaccine against dftd. d) the lack of genetic variation in the immune system of tasmanian devils minimizes resistance to the disease.
Answers: 3

Biology, 22.06.2019 10:30
Error analysis: what might be the reason that some of your percentages didn't exactly match your predicted results? gametes aren't responsible for inheritance. mice don't have large litters, so the sample size was not large enough. the wrong type of mice were used.
Answers: 3

Biology, 22.06.2019 15:30
Which of the following statements is correct in hour our immune system responds to a potential pathogen? a. the adapted immune system will call on the innate immune system to destroy the pathogen. b. b cells will start reading the antigen code immediately and call t cells to assist in destroying the pathogen. c. the skin will be the first line of defense, and then the many phagocytes in the bloodstream will attempt to consume the possible pathogen. d. the t-cells in the adapted immune systems are the first to recognize the pathogen vaccines are weakened forms of disease causing microorganisms, which are given to patients to prevent disease. after the vaccine is administered, the immune system responds by creating a(n) to recognize the a. antigen, antibody b. antibody, antigen c. antibody, antibiotic d. antibiotic, antibody
Answers: 1
You know the right answer?
Which type of graph would be best to show qualitative data?
numerical data graph example
Questions

Mathematics, 07.11.2020 01:00


English, 07.11.2020 01:00


English, 07.11.2020 01:00


History, 07.11.2020 01:00

Mathematics, 07.11.2020 01:00

Mathematics, 07.11.2020 01:00


History, 07.11.2020 01:00

Mathematics, 07.11.2020 01:00

Mathematics, 07.11.2020 01:00

Mathematics, 07.11.2020 01:00


