
Biology, 02.06.2021 23:10 sushiboy668
Creating a Genetic Pedigree Chart
Genes regulate the shape of pea plant seeds. A pea plant produces either round or wrinkled seeds. In this activity, you will create a lineage of pea plants. You will evaluate the possibility of pea plants exhibiting dominant and recessive traits over four generations
Part A
The letter R indicates round seeds that are dominant over the wrinkled variety, represented by r. Create a Punnett square by selecting the genetic makeup of the parents. You can make the parents both hom ozygous, both heter ozygous, or a combination. Show the possible outcomes of the traits in their offspring.
Part B
Question
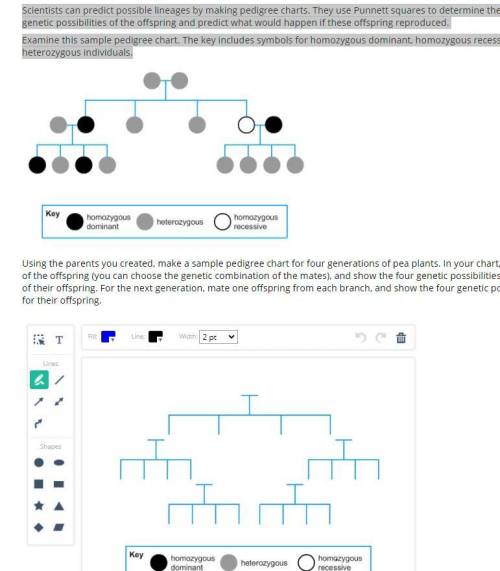
Scientists can predict possible lineages by making pedigree charts. They use Punnett squares to determine the four genetic possibilities of the offspring and predict what would happen if these offspring reproduced.
Examine this sample pedigree chart. The key includes symbols for hom ozygous dominant, hom ozygous recessive, and heter ozygous individuals.
Part C
Using the pedigree chart you made, explain why scientists use the word dominant for certain traits.
Part D
The lineage of pea plants produced round seeds for four generations. The plants that fertilized these pea plants also produced round seeds. However, in the fifth generation, the plant produced to two plants with wrinkled seeds. Can that be possible? Explain your answer using your pedigree chart.
Part E
Two students fertilize a pair of pea plants. One plant is Rr, and the other is rr. The offspring produced by these two plants all had the dominant trait. The Punnett square showed that there was a 50 percent chance of the offspring carrying rr genes. So, the student assumes that he made an error in determining the genetic makeup of the plants. Do you think the student made an error, or is there another explanation? Explain your answer.

Answers: 2


Another question on Biology
Biology, 22.06.2019 05:00
This comparative chart is an example of one that might be used by scientists and law enforcement personnel for identification purposes. the chart represents a technological advance called
Answers: 2
Biology, 22.06.2019 09:50
The frequency of alleles in a population that is in hardy weinberg equilibrium? a . changes in each successive generation b. is less important than the frequency genotypes c. shows evidence of the process of natural selection d. remains the same over several generations
Answers: 2
Biology, 22.06.2019 13:00
What is gene expression control that occurs after the generation of rna
Answers: 3
You know the right answer?
Creating a Genetic Pedigree Chart
Genes regulate the shape of pea plant seeds. A pea plant produces...
Questions

English, 15.10.2019 12:30


Mathematics, 15.10.2019 12:30

Mathematics, 15.10.2019 12:30
History, 15.10.2019 12:30
History, 15.10.2019 12:30
Biology, 15.10.2019 12:30

Arts, 15.10.2019 12:30
Mathematics, 15.10.2019 12:30
Mathematics, 15.10.2019 12:30


