
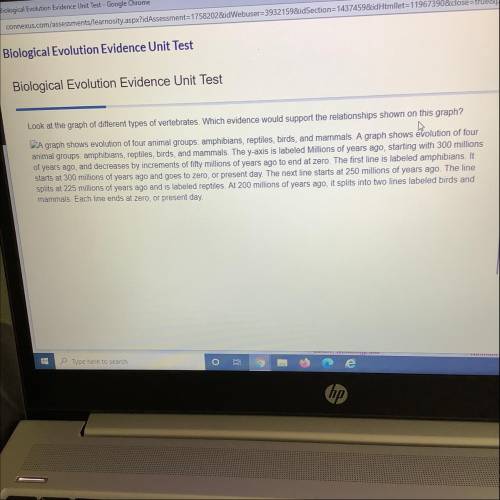
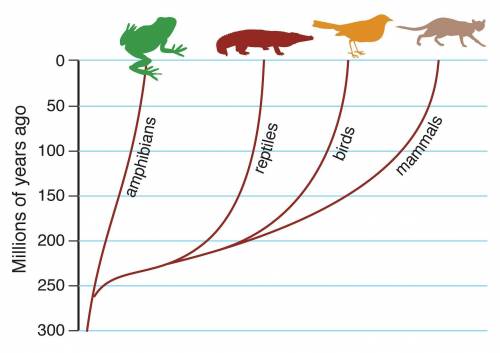
Look at the graph of different types of vertebrates. Which evidence would support the relationships shown on this graph?
DA graph shows evolution of four animal groups: amphibians, reptiles, birds, and mammals. A graph shows evolution of four
animal groups: amphibians, reptiles, birds, and mammals. The y-axis is labeled Millions of years ago, starting with 300 millions
of years ago, and decreases by increments of fifty millions of years ago to end at zero. The first line is labeled amphibians. It
starts at 300 millions of years ago and goes to zero, present day. The next line starts at 250 millions of years ago. The line
splits at 225 millions of years ago and is labeled reptiles. At 200 millions of years ago, it splits into two lines labeled birds and
mammals. Each line ends at zero, or present day
Omg pls help I also shared the pic as well for help

Answers: 1


Another question on Biology
Biology, 21.06.2019 23:00
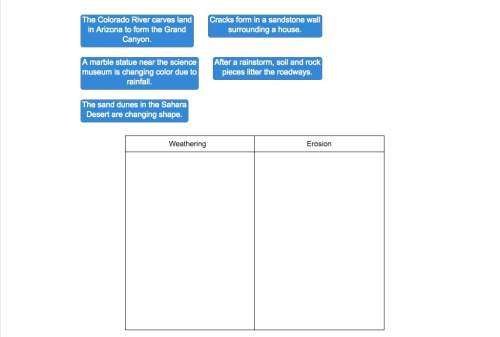
Use the drop down menus to match each example to the fossil topic discussed then to show how the fossil record gives evidence of evolution
Answers: 1
Biology, 22.06.2019 00:30
Which element forms the basis of all organic organisms a carbon b oxygen c hydrogen d nitrogen
Answers: 2
Biology, 22.06.2019 04:00
Will mark brainliest i only need the ! 1.use ten beads and a centromere of one color to construct the long chromosome. use ten beads and a centromere of a second color to construct the second chromosome in the long pair. make a drawing of the chromosomes in the space below. 2. for the second pair of chromosomes, use only five beads. 3. now model the replication of the chromosomes. make a drawing of your model in the space below. part b: meiosis i during meiosis i, the cell divides into two diploid daughter cells. 4. pair up the chromosomes to form tetrads. use the longer tetrad to model crossing-over. make a drawing of the tetrads in the space below. 5. line up the tetrads across the center of your “cell.” then model what happens to the chromosomes during anaphase i. 6. divide the cell into two daughter cells. use the space below to make a drawing of the result. part c: meiosis ii during meiosis ii, the daughter cells divide again. 7. line up the chromosomes at the center of the first cell, one above the other. separate the chromatids in each chromosome and move them to opposite sides of the cell. 8. repeat step 7 for the second cell. 9. divide each cell into two daughter cells. use the space below to make a drawing of the four haploid cells
Answers: 1
You know the right answer?
Look at the graph of different types of vertebrates. Which evidence would support the relationships...
Questions


Chemistry, 21.08.2019 02:30


Physics, 21.08.2019 02:30
Mathematics, 21.08.2019 02:30
Mathematics, 21.08.2019 02:30
Mathematics, 21.08.2019 02:30

Social Studies, 21.08.2019 02:30

Arts, 21.08.2019 02:30

Biology, 21.08.2019 02:30
Chemistry, 21.08.2019 02:30
Mathematics, 21.08.2019 02:30
Biology, 21.08.2019 02:30


