
Biology, 27.01.2021 02:50 lizethyyaritza16
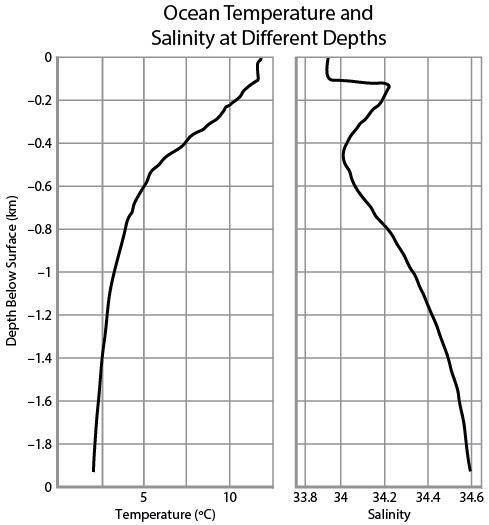
The graphs below show the change in temperature and salinity of a region of ocean as an instrument is lowered below the surface. Depth is measured in kilometers below the surface, temperature in degrees Celsius, and salinity in parts per thousand.
Image of two graphs. The left graph has the x-axis labeled temperature (degree C) ranging from 0 to 10. The y-axis is labeled depth below surface (km) ranging from -1.8 to 0. The line on graph goes up vertically starting at about 2 °C on the x-axis and -1.9 km on the y-axis. The vertical line goes up staying at about 2 degree C and climbs from -1.9 km to about -0.8 km. The line starts to shift right at -0.6 km. The line shifts to the right from 2 degree C to 5 degree C. The line shifts to right more starting at -0.5 km and reaches 10 °C around -0.2 km. The line continues up vertically after -0.2 km. The right graph has the x-axis labeled salinity ranging from 33.8 to 34.6. The y-axis is labeled depth below surface (km) ranging from -1.8 to 0. The line on the graph starts at 34 on the x-axis and 0 km on the y-axis. The line starts to shift to the right at -0.1 km and levels out at 34.2 on the x-axis. At -0.2 km the line shifts to the left and continues to shift left until it reaches -0.5 km. The line starts to shift to the right again at -0.6 and continues to shift right until it reaches -1.9 km on the y-axis and 34.6 on the x-axis.
© 2015 protonsforbreakfast. wordpress
What is the most valid conclusion regarding ocean salinity based on the data?
Ocean salinity is not related to water temperature.
Ocean salinity changes with depth at a steady rate throughout the entire water column.
Ocean salinity increases as ocean temperature decreases.
Ocean salinity is more stable at higher temperatures than at lower temperatures.

Answers: 1


Another question on Biology
Biology, 21.06.2019 21:00
Which of these serves as a reference for comparison during a scientific investigation? a)outcome variable (dependent variable) b) test variable (independent variable) c)control group d)hypothesis
Answers: 1
Biology, 22.06.2019 09:10
Research question: why are the carrots that grew on the left side of the garden larger than the carrots that grew on the right side of the garden? which hypothesis is based on this research question? a comparison of people with gardens to people without gardens will show who is likely to live longer. b. carrots are thought to be good for your eyesight and should be eaten regularly. c. carrots that are provided lots of sunlight grow to a larger size than carrots grown in the shade. d. eating fresh vegetables every day is a healthy thing to do.
Answers: 1
Biology, 22.06.2019 09:30
The ruiz family is exchanging euros for us dollars. the exchange rate is 1 euro equals 1.35261 usd. since the ruiz family knows that usd are stated to the nearest hundredth of a dollar, they used the conversion ratio
Answers: 1
You know the right answer?
The graphs below show the change in temperature and salinity of a region of ocean as an instrument i...
Questions


Chemistry, 13.07.2020 17:01
Mathematics, 13.07.2020 17:01
Mathematics, 13.07.2020 17:01
English, 13.07.2020 17:01

Mathematics, 13.07.2020 17:01

History, 13.07.2020 17:01
Chemistry, 13.07.2020 17:01
Mathematics, 13.07.2020 17:01
Mathematics, 13.07.2020 17:01
Mathematics, 13.07.2020 17:01


