
Biology, 18.06.2020 02:57 jamesgotqui6
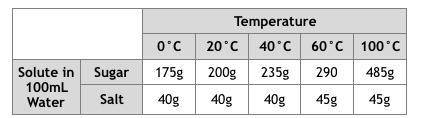
Use this data table to make a Solubility Curve (double line graph) for both sugar and table salt. Create the graph in the space below. Include the following on your graph: Title, axes labels, appropriate spacing, key.


Answers: 1


Another question on Biology
Biology, 21.06.2019 23:00
The dna in a cell’s nucleus encodes proteins that are eventually targeted to every membrane and compartment in the cell, as well as proteins that are targeted for secretion from the cell. for example, consider these two proteins: phosphofructokinase (pfk) is an enzyme that functions in the cytoplasm during glycolysis. insulin, a protein that regulates blood sugar levels, is secreted from specialized pancreatic cells. assume that you can track the cellular locations of these two proteins from the time that translation is complete until the proteins reach their final destinations.for each protein, identify its targeting pathway: the sequence of cellular locations in which the protein is found from when translation is complete until it reaches its final (functional) destination. (note that if an organelle is listed in a pathway, the location implied is inside the organelle, not in the membrane that surrounds the organelle.)
Answers: 3
Biology, 22.06.2019 08:00
Which set of terms best describes a community of miners who live out in the countryside of west virginia and use specialized geographical equipment to analyze the composition of rocks
Answers: 3
Biology, 22.06.2019 09:30
Natural resources are any materials that humans obtain from the earth to meet our wants and needs.
Answers: 3
Biology, 22.06.2019 15:40
What evidence could be used to convince policy makers to change a shipping lane from going through a whale breeding ground? information on the number of all whale species currently alive information on the number of all whales hit by boats in the given area information on the number of whale deaths in the world's oceans information on the number of whale offspring born every year. (a) scientists could collect and combine data on fish populations all around the world to show that their populations are declining. (b) scientists collect and combine data on fish populations all around the world to show that their populations are increasing. (c) scientists work together and use past data to show that fish populations are becoming locally extinct in some areas. (d) scientists work together and use past data to show that some fish populations are adapting to environmental changes.
Answers: 1
You know the right answer?
Use this data table to make a Solubility Curve (double line graph) for both sugar and table salt. Cr...
Questions

Mathematics, 02.09.2021 17:10
Mathematics, 02.09.2021 17:10
Mathematics, 02.09.2021 17:10


Social Studies, 02.09.2021 17:10

Physics, 02.09.2021 17:10


Business, 02.09.2021 17:10
Mathematics, 02.09.2021 17:10
Mathematics, 02.09.2021 17:10
Physics, 02.09.2021 17:10
Biology, 02.09.2021 17:10


