
Biology, 15.04.2020 19:21 yesharabaskoro
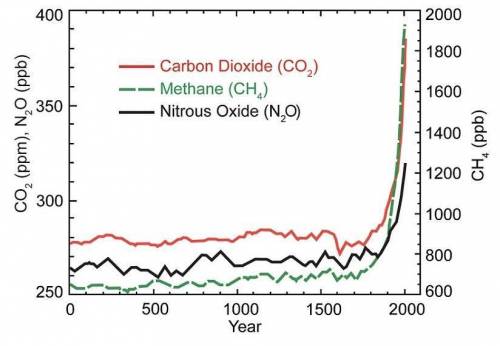
This graph shows the increase in greenhouse gas (GHG) concentrations in the atmosphere over the last 2,000 years. Increases in concentrations of these gases since 1750 are due to human activities in the industrial era. List three possible human-activity sources for these emissions.

Answers: 2


Another question on Biology
Biology, 21.06.2019 23:00
Which image shows labeled organelles that are present only in plant cells?
Answers: 1
Biology, 22.06.2019 04:40
The cluster of developing cells from conception until birth is called an
Answers: 1
Biology, 22.06.2019 08:30
The image below shows a weather service map. which details best describe this map? check all that apply
Answers: 1
You know the right answer?
This graph shows the increase in greenhouse gas (GHG) concentrations in the atmosphere over the last...
Questions


History, 25.11.2021 14:00

Business, 25.11.2021 14:00

Chemistry, 25.11.2021 14:00


Social Studies, 25.11.2021 14:00


Computers and Technology, 25.11.2021 14:00
History, 25.11.2021 14:00


Physics, 25.11.2021 14:00
History, 25.11.2021 14:00
English, 25.11.2021 14:00


