
Advanced Placement (AP), 23.02.2021 17:50 Svetakotok
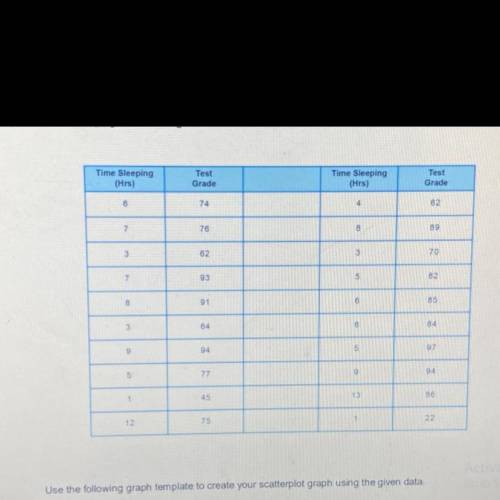
create a scatter plot graph depicting the data on sleep duration and academic performance and interpret the results and prevent possible solutions for improvement.

Answers: 2


Another question on Advanced Placement (AP)
Advanced Placement (AP), 23.06.2019 10:30
I’m giving out free points and brainliest to whoever answers this fast and correct : ) if you want to obtain a class e license before you turn 18, you a. be in compliance with school attendance requirements b. have proof of employment c. be a u.s. citizen d. own a motor vehicle
Answers: 2
Advanced Placement (AP), 24.06.2019 19:00
Melissa is fearful of men and refuses to go on dates. her therapist suggests that she is fearful because she was sexually abused when she was young. the therapist's suggestion most clearly reflects a perspective. a.) humanistic b.) behavioral c.) biological d.) psychoanalytic e.) sociocultural
Answers: 1
Advanced Placement (AP), 26.06.2019 08:30
Which side did jupiter chose in the trojan war
Answers: 1
Advanced Placement (AP), 26.06.2019 15:00
(adapted from m. m. duguid and j. a. goncalo, living large: the powerful overestimate their own height. ) in a study of power and self-image, participants were not told the true purpose of the study; instead, they believed they were participating in a business simulation. researchers randomly assigned participants to a high power(n = 44) or low-power (n = 44) condition. in the high-power condition, participants recalled a time when they had power over others, and in the low-power condition, they recalled a time when others had power over them. participants were asked to adjust the height (in centimeters) of an electronic graphical image (an avatar)of themselves to reflect their personal appearance. results indicated a statistically significant difference in participants’ perceptions of their own height across the two conditions. participants in the high-power condition created taller self-images (mean = 6.0, standard deviation = 1.5) than participants in the low-power condition(mean = 4.0, standard deviation = 1.0). * describe independent variable- describe how researchers measured the independent variable- explain why the researchers can conclude that there is a cause-and-effect relationship between the independent and dependent variables. - explain what statistical significance means in the context of the study.- explain why debriefing would be necessary in the study. -
Answers: 3
You know the right answer?
create a scatter plot graph depicting the data on sleep duration and academic performance and interp...
Questions

Mathematics, 25.02.2021 01:00


History, 25.02.2021 01:00

Mathematics, 25.02.2021 01:00

Mathematics, 25.02.2021 01:00
Mathematics, 25.02.2021 01:00
Mathematics, 25.02.2021 01:00
Biology, 25.02.2021 01:00
Mathematics, 25.02.2021 01:00

Physics, 25.02.2021 01:00
History, 25.02.2021 01:00

English, 25.02.2021 01:00
Mathematics, 25.02.2021 01:00


