
Advanced Placement (AP), 24.11.2020 20:40 odellbeckham7171
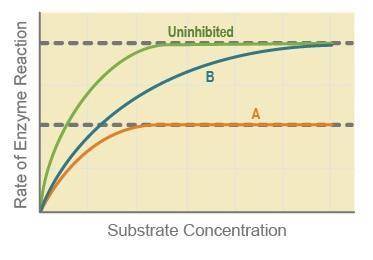
A graph shows substrate concentration on the x axis and rate of enzyme reaction on the y axis. Line labeled uninhibited rises steeply from the 0 point and then levels off at a high rate of enzyme reaction before moving horizontally to end of graph. Line B starts at 0 and rises gradually to meet uninhibited line at high rate of reaction at end of graph. Line A starts at 0, rises gradually to about halfway up y axis then moves horizontally to end of graph.
The image shows the rate of an enzyme reaction under conditions of no inhibition, competitive inhibition, and noncompetitive inhibition as reactions labeled uninhibited, A, and B. Which of the following best explains what has occurred in the enzyme reactions?
A. Reaction B shows competitive inhibition, where increased substrate competes with inhibitors for the active site.
B. Reaction A shows noncompetitive inhibition, where increased substrate competes with inhibitors for the active site.
C. Reaction A shows competitive inhibition, where increased substrate does not affect the enzyme’s binding with the inhibitor.
D. Reaction B shows noncompetitive inhibition, where increased substrate does not affect the enzyme’s binding with the inhibitor.

Answers: 2


Another question on Advanced Placement (AP)
Advanced Placement (AP), 23.06.2019 17:00
What are the main functions of the human skeleton? a exchange of gases b support and movement c sensing the environment d digestion and excretion
Answers: 2
Advanced Placement (AP), 24.06.2019 16:00
Which organisims can cause diseases a. micro organisims b. multicellular organisnims c. both d. neither
Answers: 1
Advanced Placement (AP), 24.06.2019 19:00
In 2004 how many nightly car accidents were there
Answers: 2
Advanced Placement (AP), 25.06.2019 11:50
Some studies have found that what percentage of students have cheated in some form? a. 10% b. 25% c. 45% d. 75%
Answers: 1
You know the right answer?
A graph shows substrate concentration on the x axis and rate of enzyme reaction on the y axis. Line...
Questions

Mathematics, 19.11.2020 19:00

Arts, 19.11.2020 19:00


Computers and Technology, 19.11.2020 19:00

Physics, 19.11.2020 19:00
Mathematics, 19.11.2020 19:00
Mathematics, 19.11.2020 19:00


Social Studies, 19.11.2020 19:00

Chemistry, 19.11.2020 19:00
Mathematics, 19.11.2020 19:00

Mathematics, 19.11.2020 19:00


