12. the following data represent scores of 34 students on a calculus test.
om aange=34
7...

Advanced Placement (AP), 28.10.2019 06:31 michaellowe8434
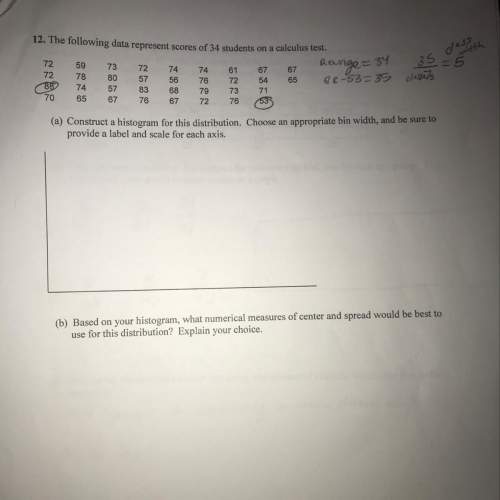
12. the following data represent scores of 34 students on a calculus test.
om aange=34
72 5973
72
72
74 74 61 67 67
72 78 80 57 56
56 76 72 54
86-53= 35
65
889 74 57 83 68
79
73
71
70 65
67
72 76
35
classes
67
(a) construct a histogram for this distribution. choose an appropriate bin width, and be sure to
provide a label and scale for each axis.
(b) based on your histogram, what numerical measures of center and spread would be best to
use for this distribution? explain your choice.

Answers: 3


Another question on Advanced Placement (AP)
Advanced Placement (AP), 25.06.2019 14:00
Augustus of prima porta connects to the subtheme identity performance cultures power
Answers: 1
Advanced Placement (AP), 25.06.2019 15:30
Which of the following types of stars had the smallest initial mass? which of the following types of stars had the smallest initial mass?
Answers: 1
Advanced Placement (AP), 25.06.2019 18:30
In which of the following conflicts did the distribution of ethnic groups act as a centripetal force? cyprus afghanistan north and south korea iraq former yugoslavia
Answers: 1
Advanced Placement (AP), 25.06.2019 22:00
Which part of each sentence is a dependent clause? the boys didn’t think dani could win the race even though she was on the school track team. trisha went down to the farmer’s market so she could get some apples. after he was injured by a stray ball, alex was sent to the nurse’s office. though he hated math, chris tried to do the equations.
Answers: 1
You know the right answer?
Questions


Mathematics, 06.05.2020 06:36

History, 06.05.2020 06:36

Health, 06.05.2020 06:36

Social Studies, 06.05.2020 06:36

History, 06.05.2020 06:36

Computers and Technology, 06.05.2020 06:36

Arts, 06.05.2020 06:36
Mathematics, 06.05.2020 06:36
Physics, 06.05.2020 06:37


